


|
SoCoder -> Article Home -> Advanced Techniques |
|
|
|
|
Scherererer
|
Calculus::DerivativesThe Basics of Derivatives in Calculus |
Calculus::Derivatives, The Basic IdeaThis article assumes an understanding of algebra and simple graphing, and will go over the basics of one of the fundamental concepts to calculus, which is the derivative. FunctionsFirst and foremost, to ensure clarity, we will define what a function is, as it relates to mathematics. You can skip ahead if you have a clear understanding of them. You may have seen a simple line, in the formy = mx + b Where m is the slope and b is the line's offset on the y-axis. This can be rewritten simply as f(x) = mx + b In this example, f is a function of x. What that means, is that x is a parameter, or independent variable, and the value of f is dependent on x. The key is, that y is arbitrary, and multiple y values could be at the same x value, conversely, as with any function, f can only have one value for each x value put into it. Here's some graphs, identifying which are functions and which are not:  If we want to find f(x) at a certain value of x, we simply plug it in. For example, given the equation f(x) = 5x^2 + 3 to find f(x) at, say, 2, we just plug it in, and write it like this: f(2) = 5(2)^2 + 3 f(2) = 5*4 + 3 f(2) = 20 + 3 f(2) = 23 The LimitBefore I explain what the derivative is, we need to have a little background for its definition, and we get that from what is called a limit. Limits are the values of a function which is approached, but not necessarily reached. So, for instance, here is the limit of a few different functions: As you can see, the line in the first and second examples are essentially the same. If you do the algebra on the second example (factor out the numerator, then cancel and simplify), you can see that they form the same equation. However, this equation has what is called a removable discontinuity when unsimplified, and it is technically wrong to simplify, because that creates a singularity. As in, a value of f shouldn't exist at x=2. But anyway, this helps us exemplify what a limit is better, because as you can see, even though there is no value for f at x=2, the limit as x approaches 2 does exist. The limit of a function exists iff (if and only if) the left and right limits exist, and are equal to one another. What this means, is that if you were following the graph from the left, approaching some value of x, and you wrote down that value, and then you did the same thing except approaching from the right, then the limit would exist only if those two values were the same. To better explain this, here's an example of a graph where those values aren't the same:  As you can see, the limit from the left is 3, but the limit from the right is 4. Since these two values do not equal one another, it can be concluded that the limit as x approaches 2 does not exist. The DerivativeNow that we know what functions are, and what limits are, we can finally learn about the derivative.Consider the graph of some curve f(x). We can identify two points on this curve, (x0,f(x0)) and (v,f(v)), where v is a value on the x-axis. This can be rewritten as the points (x0,f(x0)) and (x0+h, f(x0+h)) where h is the distance between x0 and v, because x+h=v. Now, we'll draw a line between these two points, and examine that line's slope  As you can see, we end up with the simplified form (f(x0+h)-f(x0))/h. But what happens as h gets closer to 0?  If we take the limit of our slope equation that we just derived, as you can see, we get the definition of a derivative! Geometrically, the derivative of a given point is the slope of the tangent line of the curve at that point. We can extend this definition to show that a derivative is a measurement of the amount of change that occurs in a graph at a given point. The power of this mathematical correlation are almost limitless (no pun intended). Let's look at some examples of how this is used: Physics If you were to have the graph of some objects position in one direction versus time, then you can find its velocity by taking the derivative of its position. Then to get acceleration, you just take the derivative of the velocity. Computer Vision If you take the derivative of the pixels in a picture, then you end up with the change in color values. This can be used to identify edges, because where the color changes more, there is an edge, and the derivative will represent a much larger slope than a place where the colors in the pixels changes very little. (code example) Engineering You can use derivatives to find where maximum and minimum values of an equation occur (the derivative at that point will be equal to zero), and then use that for a type of equation-solving called optimization. This is very useful whether you're maximizing surface area, or minimizing fuel consumption, or anything else you can think of where you need to identify a maximum or minimum value of a function. There are tons of other uses for this, and even more as you continue learning more about calculus, including with concepts such as the integral, which is the opposite of a derivative, and conveniently, describes the area under a curve, allowing for the calculation of all kinds of weird volumes, and the root explanation of all those (previously) inexplicable geometric equations that you have to memorize. I hope this helps stimulate interest here on the forum in mathematics, and I will do my best to continue posting more math-related articles, and especially more examples on how they can be used, both in programming and other areas. |
|
|
|
|
Comments |
|
| Monday, 20 July 2009, 10:25 | |
shroom_monk
|
This is pretty interesting!  I didn't know much about this before, and it sounds quite useful. I didn't know much about this before, and it sounds quite useful.One question though... When you explain limits, you say that the first two lines are the same, only the second has a singularity. But when I plotted the graphs (using Geogebra), I got this: 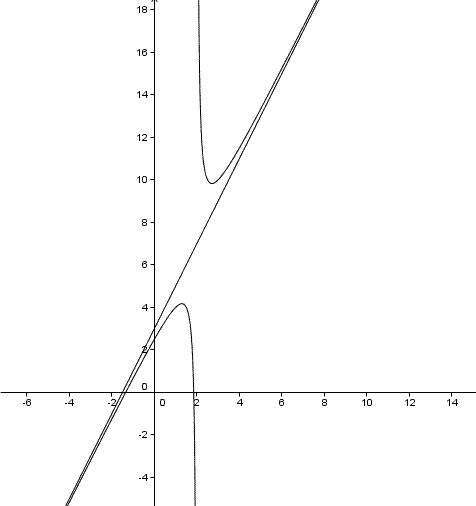 The straight line is the first graph, and the curved is the second. So are they really the same, or are they different? Because the second graph seems to disappear to infinity. |
| Monday, 20 July 2009, 10:32 | |
Scherererer
|
Hang on, double checking my math on that one~ Hmm, I graphed it with my TI-89 and it graphs the same way I wrote it... I'm downloading Geogebra and I'm going to test it in that. |edit| OH, my bad, it's -2x^2+x+6, not -2x^2+x+5, I'll change it in the article |edit| |
|
|
| |||
|
| ||||